Loggers#
Dagster includes a rich and extensible logging system. Dagster comes with a built-in logger that tracks all the execution events. You can also customize loggers to meet your own needs.
Relevant APIs#
| Name | Description |
|---|---|
@logger | The decorator used to define loggers. The decorator returns a LoggerDefinition |
LoggerDefinition | Base class for loggers. You almost never want to use initialize this class directly. Instead, you should use the decorator above |
SystemComputeExecutionContext | The context object available to a solid compute function |
ModeDefinition | Modes allow you to vary pipeline behavior between different deployment environments. For more info, see the Modes section |
Overview#
Loggers are pipeline-scoped logging handlers, which will be automatically invoked whenever solids in a pipeline log messages.
TODO: testing, debugging, ..
Defining a Logger#
By default, Dagster comes with a built-in logger that tracks all the execution events. You can find an example in the Using Built-in Loggers section.
The built-in Loggers are defined internally using the LoggerDefinition class.
The @logger decorator exposes a simpler API for the common logging
use case. It is typically what you'll use to define your own loggers. The decorated function should
take a single argument, the init_context available during logger initialization, and return a
logging.Logger. You can find an example in the Customizing Loggers section.
Using a Logger#
Logging from a Solid#
Any solid can emit log messages at any point in its computation:
@solid
def hello_logs(context):
    context.log.info("Hello, world!")


@pipeline
def demo_pipeline():
    hello_logs()
Using Built-in Loggers#
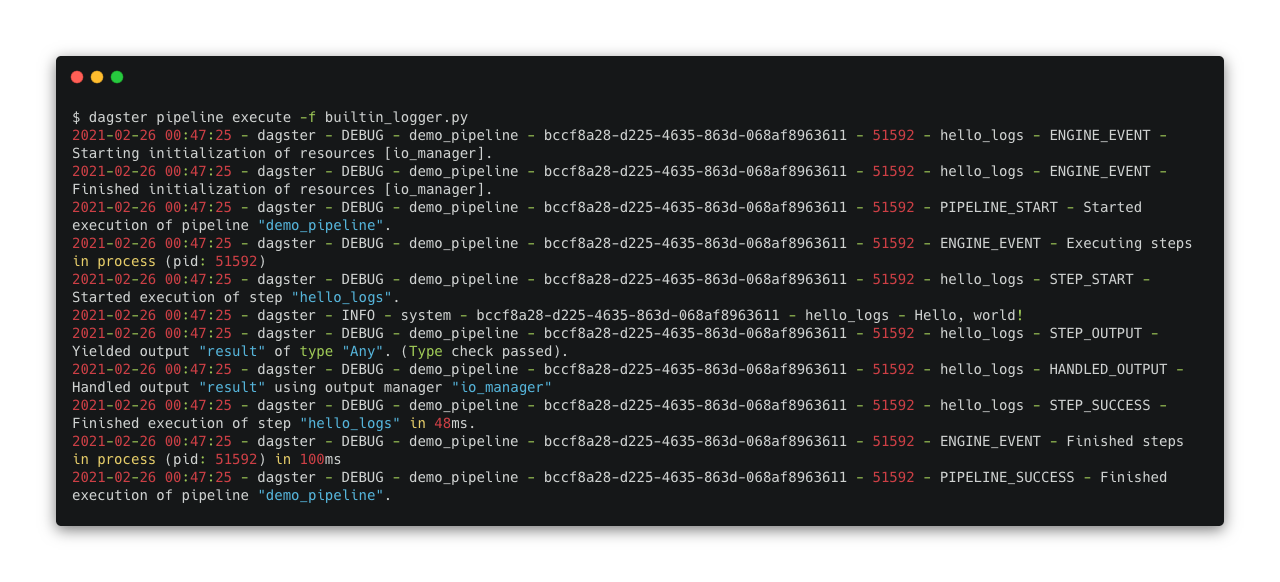
When you run the above pipeline in terminal, you'll find the messages have been logged through a built-in logger.

The context object passed to every solid execution includes the built-in log manager, context.log.
It exposes the usual debug, info, warning, error, and critical methods you would expect
anywhere else in Python.
When you run Dagster pipelines in Dagit, you'll notice that log messages are visible as colored messages in the console:
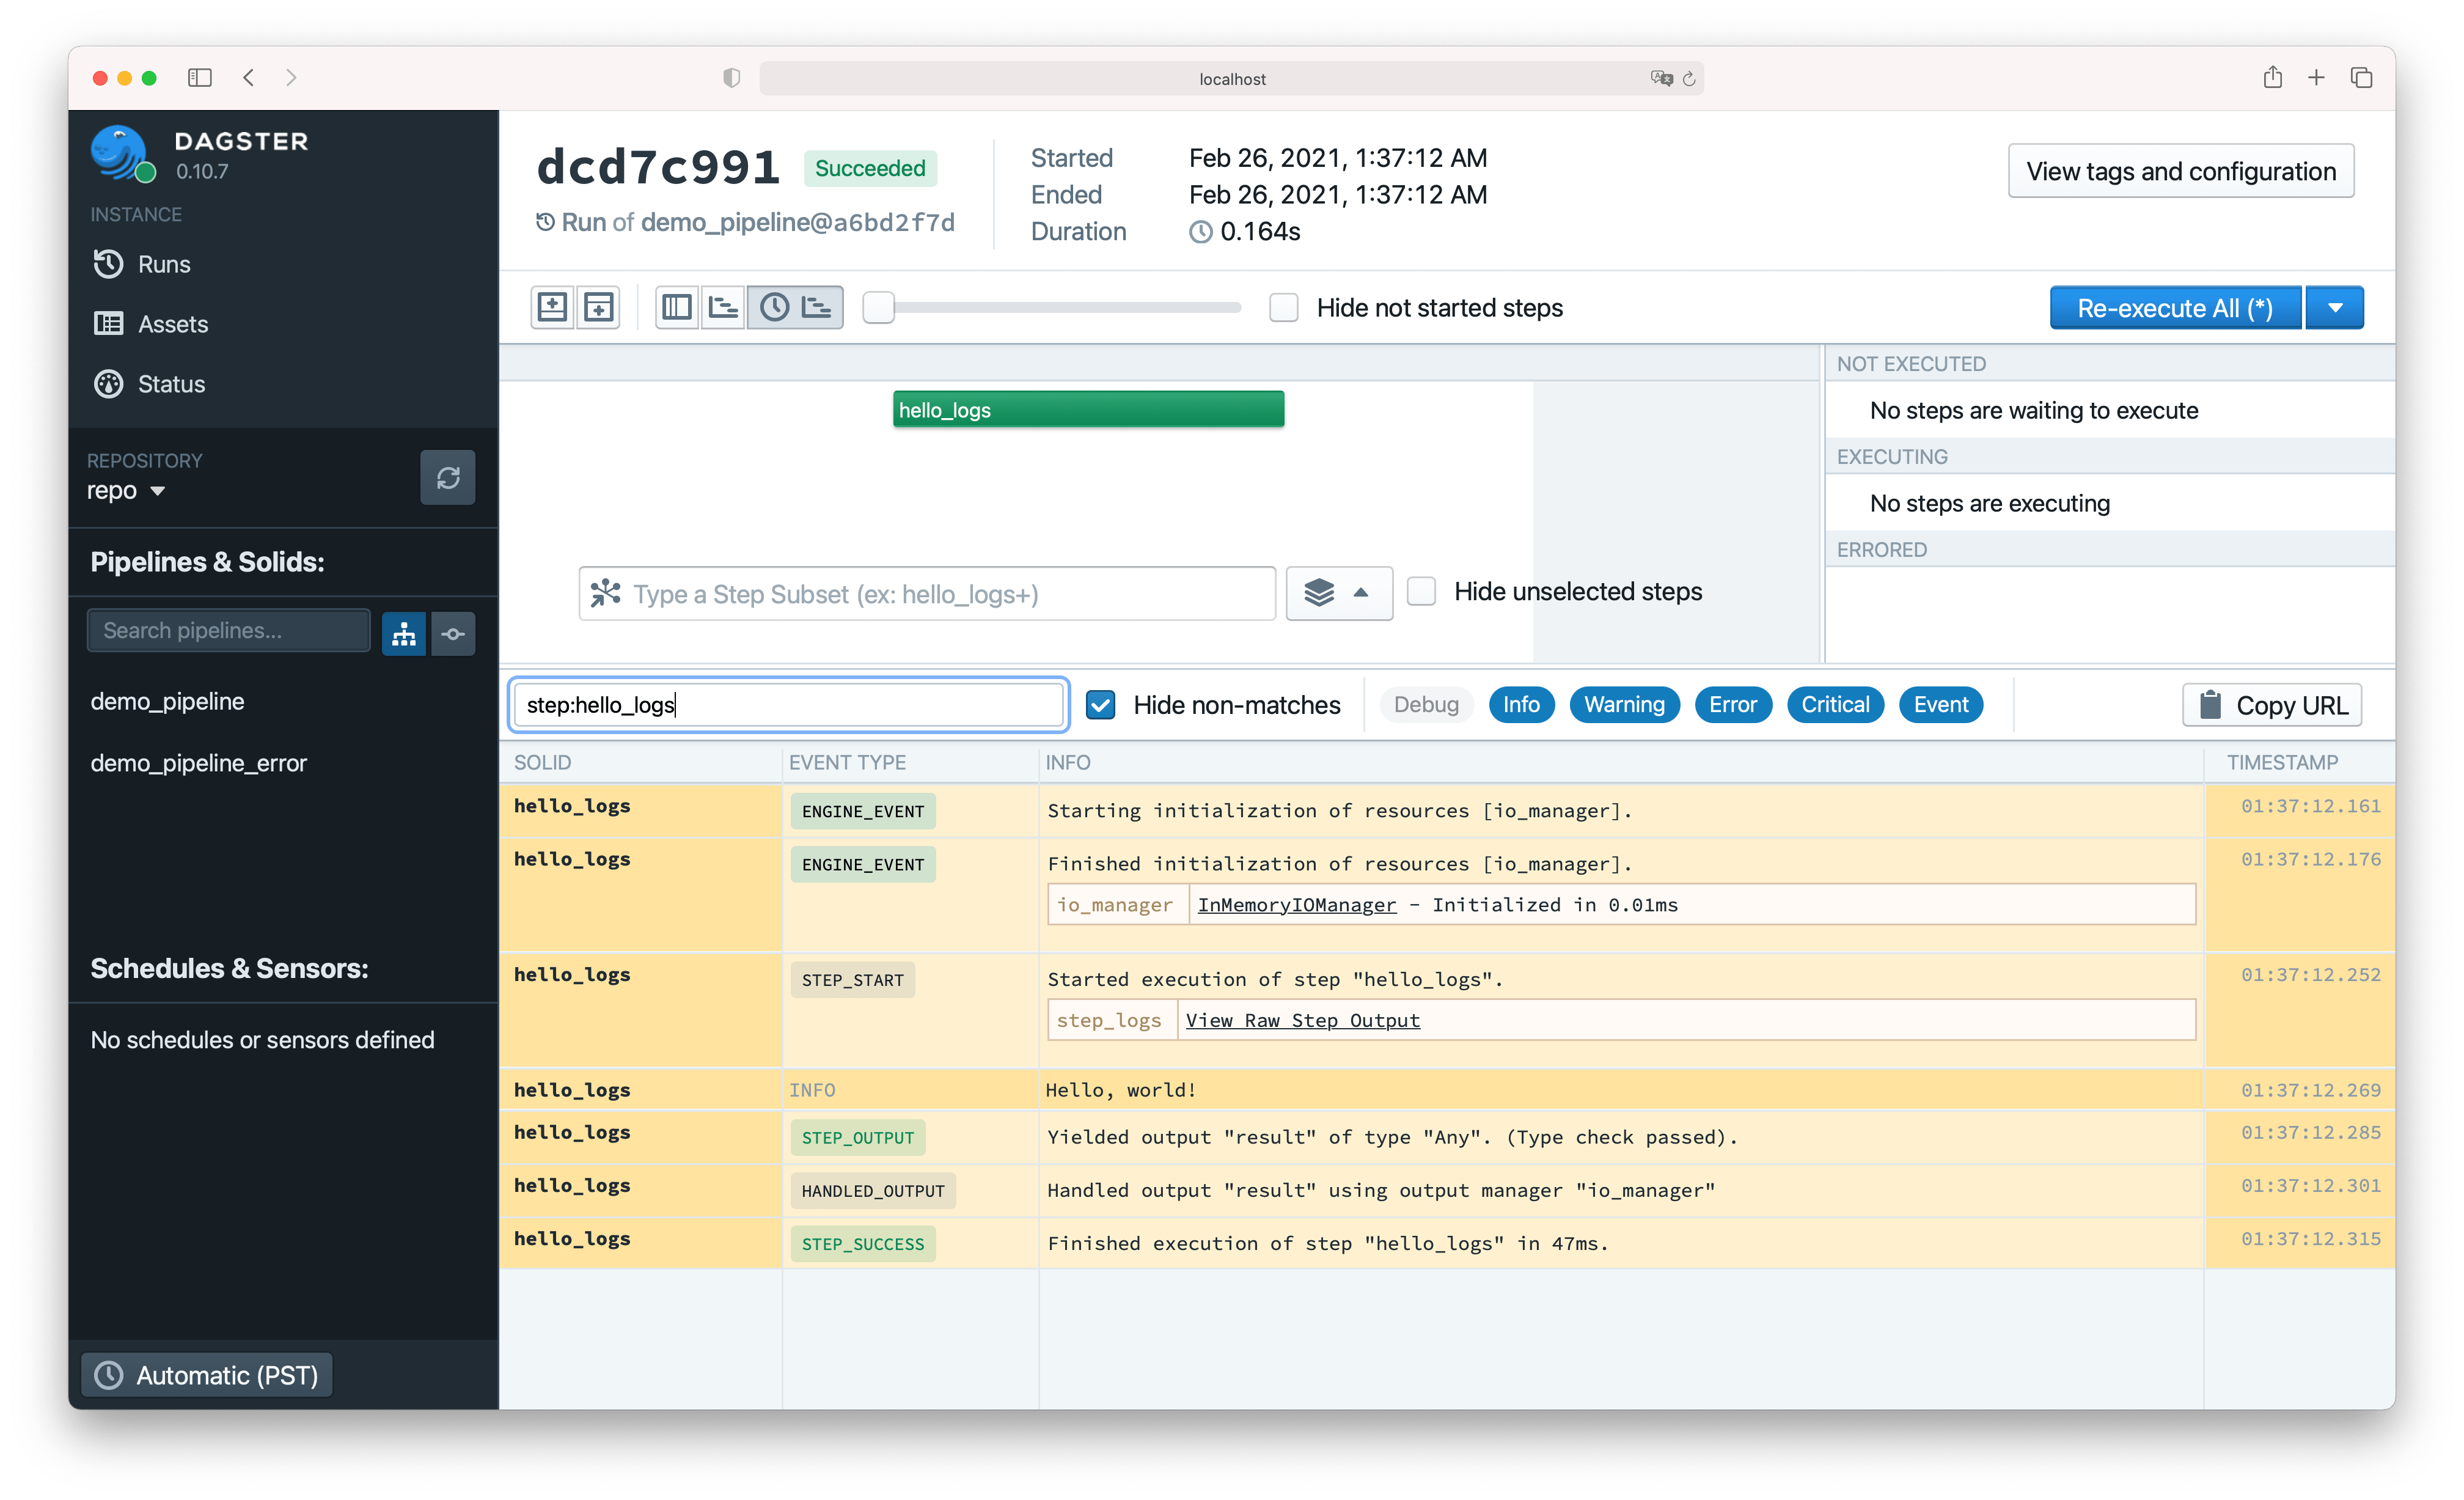
Logs also stream back to the Dagit frontend in real time:

Dagit exposes a powerful facility for filtering log messages based on execution steps and log levels.

Debugging with Logs#
What happens if we introduce an error into our solid logic?
@solid
def hello_logs_error(context):
    raise Exception("Somebody set up us the bomb")


@pipeline
def demo_pipeline_error():
    hello_logs_error()
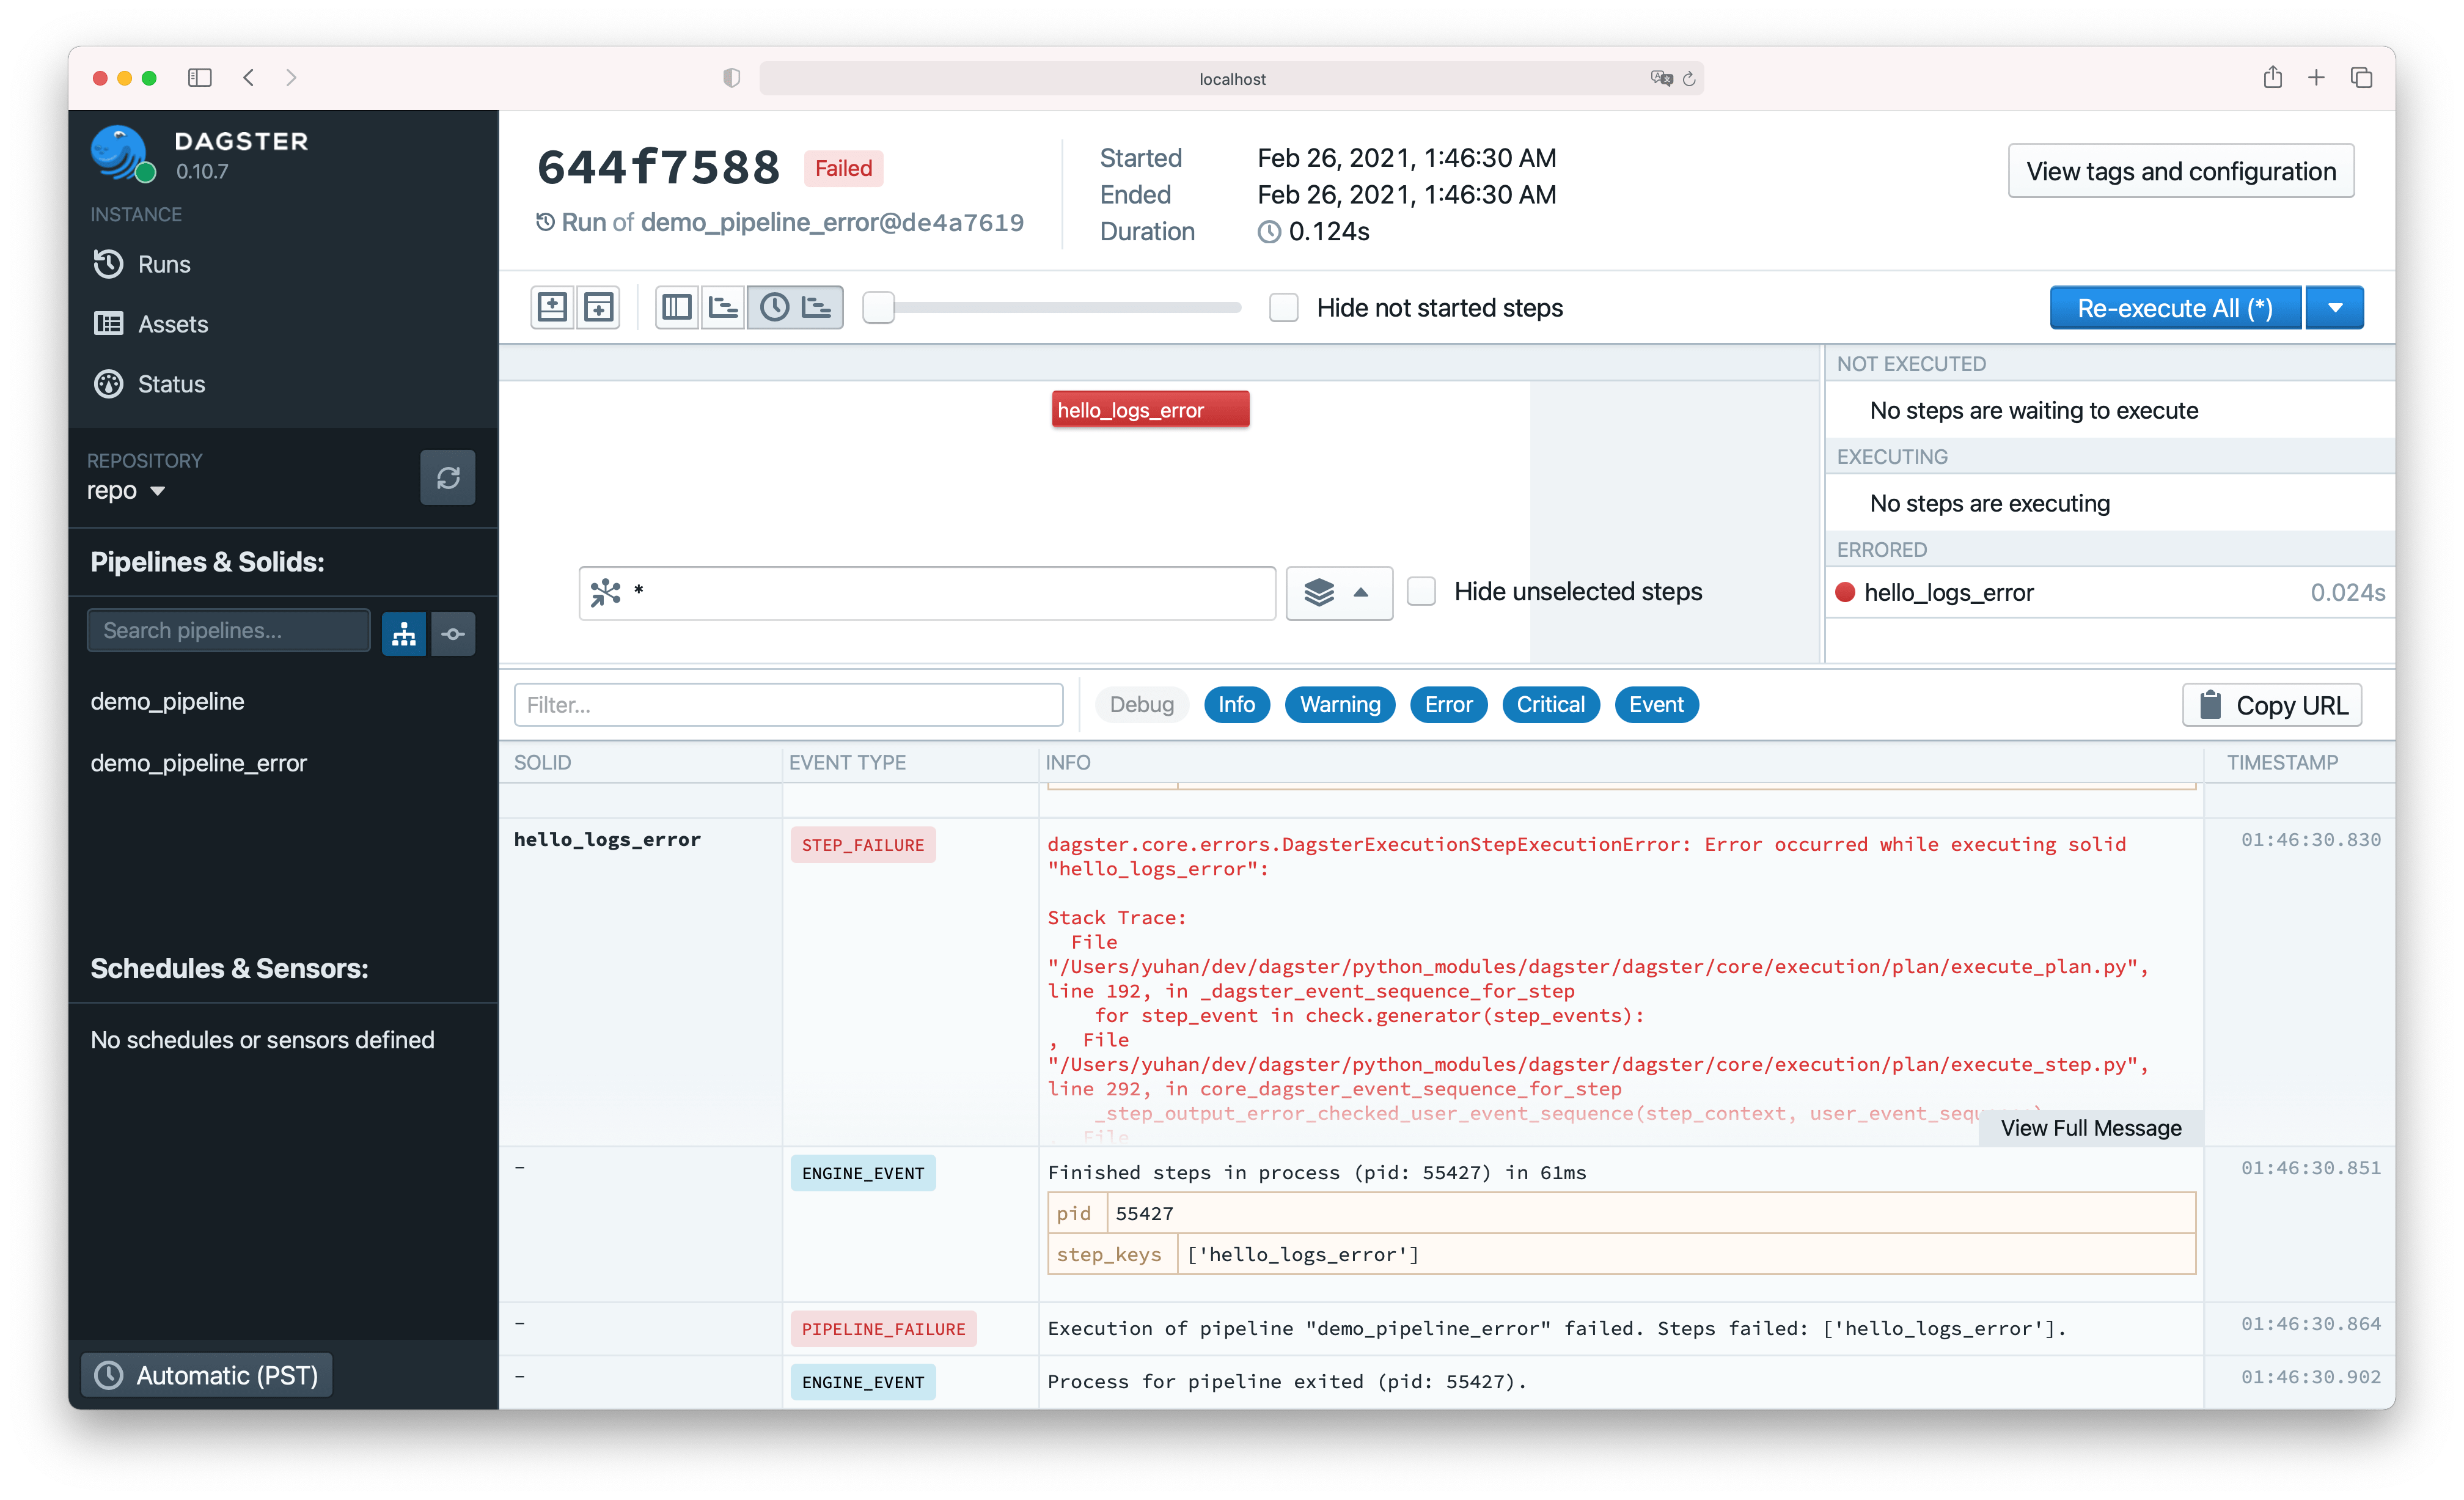
Errors in user code are caught by the Dagster machinery to ensure pipelines gracefully halt or continue to execute, but messages including the original stack trace get logged both to the console and back to Dagit.
Messages at level ERROR or above are highlighted both in Dagit and in the console logs, so
we can easily pick them out of logs even without filtering.

In many cases, especially for local development, this log viewer, coupled with solid reexecution, is sufficient to enable a fast debug cycle for data pipelines.
Examples#
Configuring the built-in loggers#
Suppose that we've gotten the kinks out of our pipelines developing locally, and now we want to run
in production—without all of the log spew from DEBUG messages that was helpful during development.
Just like solids, loggers can be configured when you run a pipeline. For example, to filter all
messages below ERROR out of the colored console logger, add the following snippet to your config
YAML:
loggers:
  console:
    config:
      log_level: ERROR
So when you execute the pipeline with that config, you'll only see the ERROR level logs.
Customizing Loggers#
You may find yourself wanting to add or supplement the built-in loggers so that Dagster logs are integrated with the rest of your log aggregation and monitoring infrastructure.
For example, you may be operating in a containerized environment where container stdout is aggregated by a tool such as Logstash. In this kind of environment, where logs will be aggregated and parsed by machine, the multi-line output from the default colored console logger is unhelpful. Instead, we'd much prefer to see single-line, structured log messages like:
{"orig_message": "Hello, world!", "log_message_id": "49854579-e4d1-4289-8453-b3e177b20056", ...}
In fact, a logger that prints JSON-formatted single-line messages like this to the console is
already included as dagster.loggers.json_console_logger. But let's look at how we might
implement a simplified version of this logger.
Loggers are defined internally using the LoggerDefinition
class, but, following a common pattern in the Dagster codebase, the @logger
decorator exposes a simpler API for the common use case and
is typically what you'll use to define your own loggers. The decorated function should take a single
argument, the init_context available during logger initialization, and return a logging.Logger.
@logger(
    {
        "log_level": Field(str, is_required=False, default_value="INFO"),
        "name": Field(str, is_required=False, default_value="dagster"),
    },
    description="A JSON-formatted console logger",
)
def json_console_logger(init_context):
    level = init_context.logger_config["log_level"]
    name = init_context.logger_config["name"]

    klass = logging.getLoggerClass()
    logger_ = klass(name, level=level)

    handler = logging.StreamHandler()

    class JsonFormatter(logging.Formatter):
        def format(self, record):
            return json.dumps(record.__dict__)

    handler.setFormatter(JsonFormatter())
    logger_.addHandler(handler)

    return logger_


@solid
def hello_logs(context):
    context.log.info("Hello, world!")


@pipeline(mode_defs=[ModeDefinition(logger_defs={"my_json_logger": json_console_logger})])
def demo_pipeline():
    hello_logs()
As you can see, you can specify the logger name in the run config. It also takes a config argument,
representing the config that users can pass to the logger, for example:
loggers:
  my_json_logger:
    config:
      log_level: INFO
When you execute the pipeline, you'll notice that you are no longer using the built-in logger but your custom json logger instead.

Patterns#
Environment-specific logging using modes#
Logging is environment-specific: you don't want messages generated by data scientists' local development loops to be aggregated with production messages; on the other hand, you may find that in production console logging is irrelevant or even counterproductive.
Dagster recognizes this by attaching loggers to modes so that you can seamlessly switch from, e.g., Cloudwatch logging in production to console logging in development and test, without changing any of your code.
@solid
def hello_logs(context):
    context.log.info("Hello, world!")


@pipeline(
    mode_defs=[
        ModeDefinition(name="local", logger_defs={"console": colored_console_logger}),
        ModeDefinition(name="prod", logger_defs={"cloudwatch": cloudwatch_logger}),
    ]
)
def hello_modes():
    hello_logs()
From Dagit, you can switch your pipeline mode to 'prod' and edit config in order to use the new Cloudwatch logger, for example:
loggers:
  cloudwatch:
    config:
      log_level: ERROR
      log_group_name: /my/cool/cloudwatch/log/group
      log_stream_name: very_good_log_stream